"Module stomping" is an approach to hiding malicious code in a process' memory, and having it appear to be a legitimately loaded module (i.e., DLL). This post will explore a variant of this technique, which involves injecting code into legitimately loaded DLLs in unused memory regions based on code coverage analysis. Supporting scripts are on GitHub.
Module stomping 101 and why do it differently?
One of the multiples factors to consider when avoiding detection with code injection is where that malicious code resides in memory. One approach to addressing this from an offensive perspective is known as "module stomping", which involves loading a legitimate DLL into a target process, and then overwriting its memory regions with a malicious alternative. Through this it will appear as if a legitimate module has been loaded (e.g., in the process' loaded module list in the PEB), despite that not being what is actually executed.
Module stomping has been part of Cobalt Strike since version 3.11, and was explored in an excellent series of articles by Aliz Hammond. I'd direct the reader to those (especially the latter) for a more detailed background to the technique.
One downside to traditional module stomping is that it relies on loading a DLL into a process - and that DLL might not necessarily ever be loaded into a particular process as part of legitimate behaviours. This can trigger further examination by threat hunters and others of the same ilk as it might raise flags when techniques such as least frequency analysis are applied. For example, why is x DLL loaded into y instance of a process on only one of z thousand hosts.
An alternative approach is to do somewhat of a "mini stomp" on an already legitimately loaded DLL by only overwriting unused memory regions. That is, when a program starts up it will legitimately load DLLs that it requires to function, and will then be executing code in certain memory regions from that - those that aren't used are then stomped. No additional module loading required, and the module load list appears just as it would with another instance of the target process.
Exploring code coverage analysis
In order to make this work there needs to be an analysis of what areas of existing modules are actually being executed. Namely for all of the threads in a process from what areas are they executing code, and how this relates to the addresses of loaded modules. If you stomp regions that are used, it will most likely crash the process, so these regions must be avoided. This can be achieved through code coverage analysis.
One code coverage tool I've found most useful is DynamoRIO's drcov. The syntax for using this tool is as follows. In this case it will track code coverage for notepad.
bin64/drrun.exe -t drcov -dump_text -- notepadOnce execution of the target program stops, it will dump a text file (it can also do a binary file) that contains the list of loaded modules and various pieces of useful information (e.g., the base and end addresses that they were loaded into memory), and a line-by-line summary of code that was executed (e.g., at offset x from module y, z bytes were executed). An example of this is shown below.
DRCOV VERSION: 2
DRCOV FLAVOR: drcov
Module Table: version 4, count 31
Columns: id, containing_id, start, end, entry, offset, checksum, timestamp, path
  0,   0, 0x0000000071000000, 0x000000007117f000, 0x0000000071099930, 00000000800f40a8, 0x0015473d, 0x5c706c34,  c:\eval\ExternalTooling\DynamoRIO-Windows-7.1.0-1\lib64\release\dynamorio.dll
  1,   1, 0x0000000077990000, 0x0000000077aaf000, 0x00000000779a5340, 00000000800f40a8, 0x00120369, 0x59b94f29,  C:\Windows\system32\kernel32.dll
  2,   2, 0x0000000077ab0000, 0x0000000077baa000, 0x0000000077aca2a0, 00000000800f40a8, 0x00100335, 0x5824a140,  C:\Windows\system32\USER32.dll
  3,   3, 0x0000000077bb0000, 0x0000000077d5a000, 0x0000000077bb0000, 00000000800f40a8, 0x001b3ef7, 0x59b94ee4,  C:\Windows\SYSTEM32\ntdll.dll
<..>
BB Table: 33878 bbs
module id, start, size:
module[  3]: 0x000000000002a540,  23
module[  3]: 0x000000000002a557,  10
module[  1]: 0x00000000000159c0,   8
module[  1]: 0x00000000000159c8,   5
module[  9]: 0x0000000000003acc,   9
As an example from the above it can be seen that a thread executed 23 bytes at the offset 0x000000000002a540 from module 3 (ntdll) which was loaded at 0x0000000077bb0000. Another 10 bytes were then executed from the same module but at offset 0x000000000002a557. The text file will contain thousands of such lines.
Identifying injection points
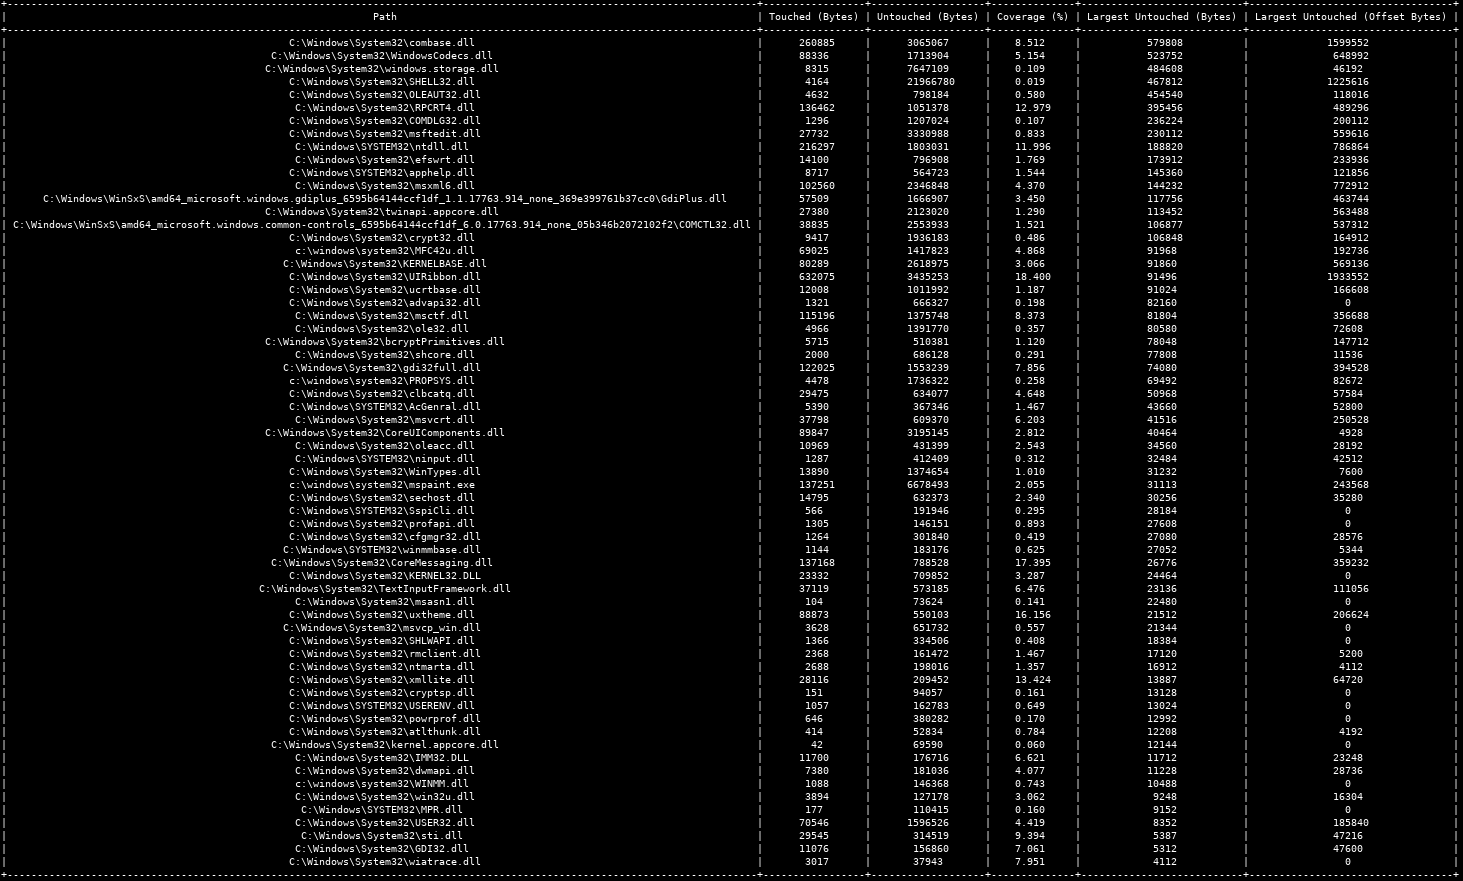
In order to make this information actionable, it needs to be parsed, so that we can identify regions of the DLL that aren't being used, including what the offset is, and how many bytes are available. I've written a script that I've placed on Github which does this (admittedly very dirty and horribly inefficient). It takes the drcov output file as an argument, and produces something like the table below. In this case, for mspaint.exe on Windows 10 (1909 Insider Preview).

In this example we can see that combase.dll only executes code from 8.5% of the regions it was loaded into memory, and the largest untouched (i.e., non-executed) region was 579814 bytes (579KB) at an offset of 1599546 bytes into the DLL. All offsets listed are 16-byte aligned for when later (post-injection) setting valid targets due to Control Flow Guard (CFG) in Windows 10.
Does this mean we can directly inject here? The answer is maybe - it depends what your injected code is doing. Remember that your injected code will also be using these modules too. To identify the injectable locatons you therefore have to actually run drcov to perform the analysis, but then inject your malicious code into this - let it run for a while, use various parts of its functionality (e.g., if it's a complex implant), and then do the code coverage analysis.
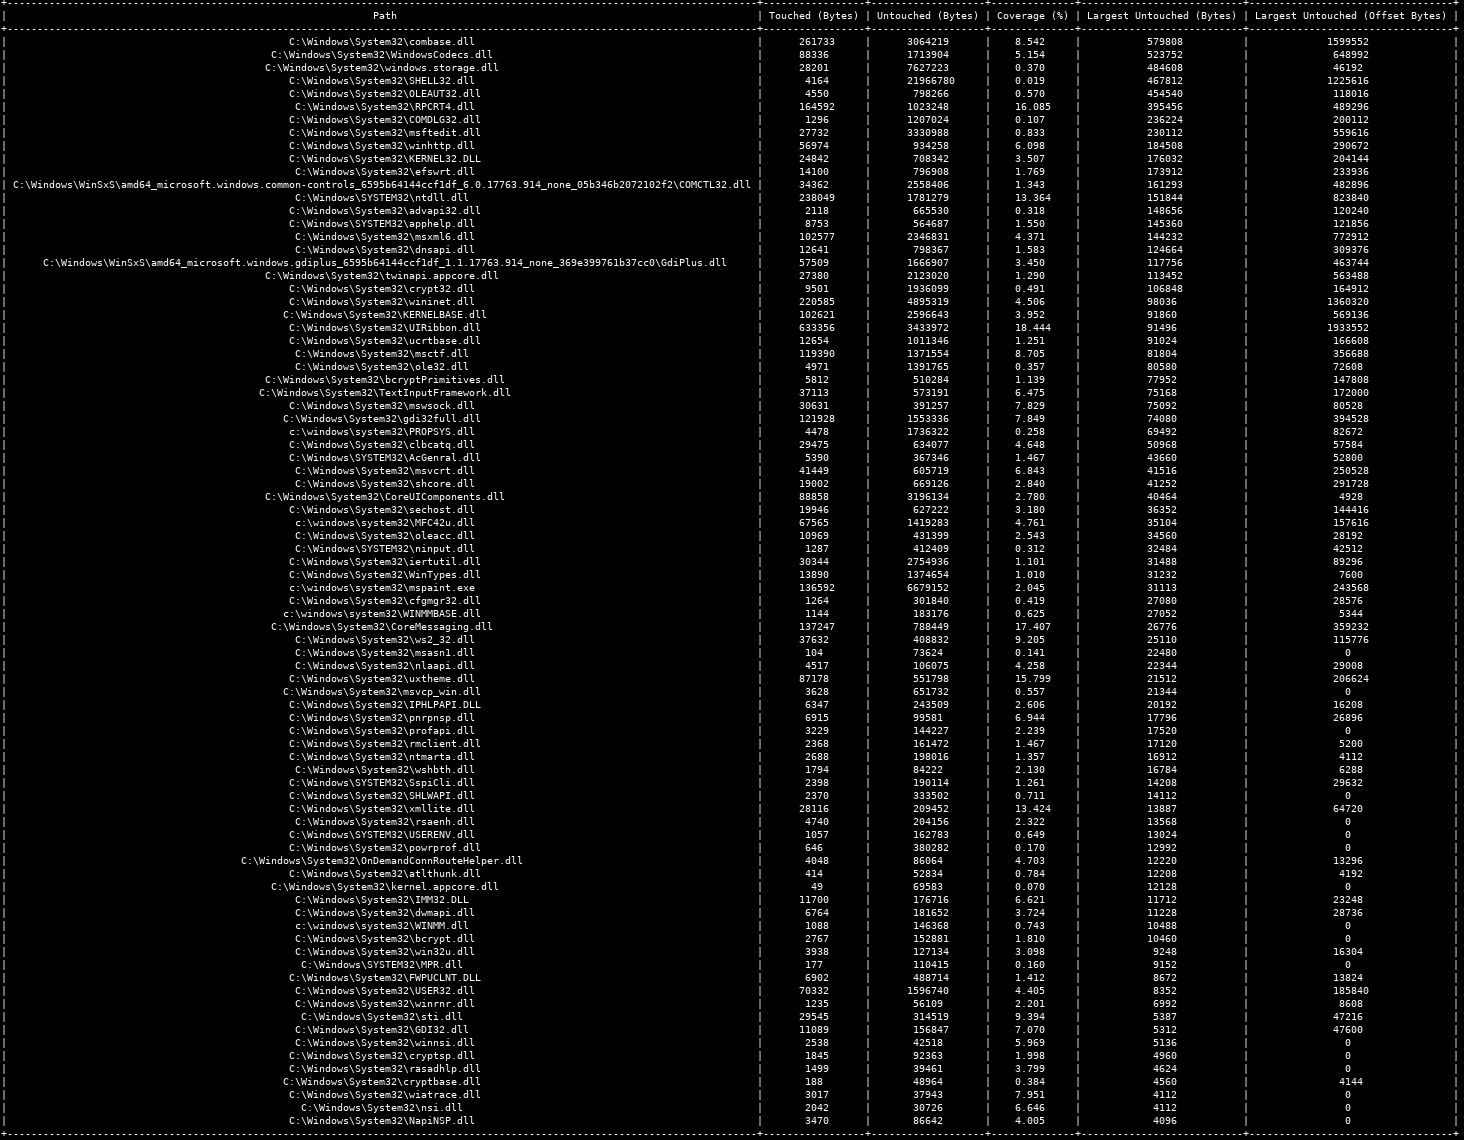
The following output shows this having been doing with mspaint.exe again, but this time with Cobalt Strike's Beacon injected into the process (note that in practice you want to be using PIC shellcode not something with a reflective loader).

Keen eyes will notice a few things:
- The first six DLLs with the largest available regions are exactly the same with respect to largest unused code region size and offset. This is particularly important for Beacon as they're the only DLLs who have unused regions that are large enough to host Beacon itself at 260KB. You can, however, see how the injected code influences unused regions in other modules, such as kernel32.dll.
- Due to the complexity of Beacon it actually loads in new modules (e.g., winhttp.dll, OnDemandConnRouteHelper.dll and FWPUCLNT.dll), which admittedly defeats the purpose of injecting into an already loaded module, as it muddys the loaded module list. Many of these arguably would never be legitimately loaded into this process in the first place. That said, for other maliciously injected code, this may not be the case depending on its complexity and how it's coded.
The one major caveat to this approach is that operating system version and patch level does influence if it will actually work. If you overwrite regions that are actually being used, it's highly likely to kill the process. Ideally you'd find a DLL that doesn't change very often and leverage that. There are some default DLLs that match this even on Windows 10 (e.g., DLLs not modified since 2011), but they're few and far between, and often tend to be small in size, and therefore, require only permit a small amount of code to be injected. With that said, as environments converge on using Windows 10, things might get a little easier. For example, I've personally found I can inject into the many of the same modules at the same locations on Windows 1809 and 1909 (Insider Preview).
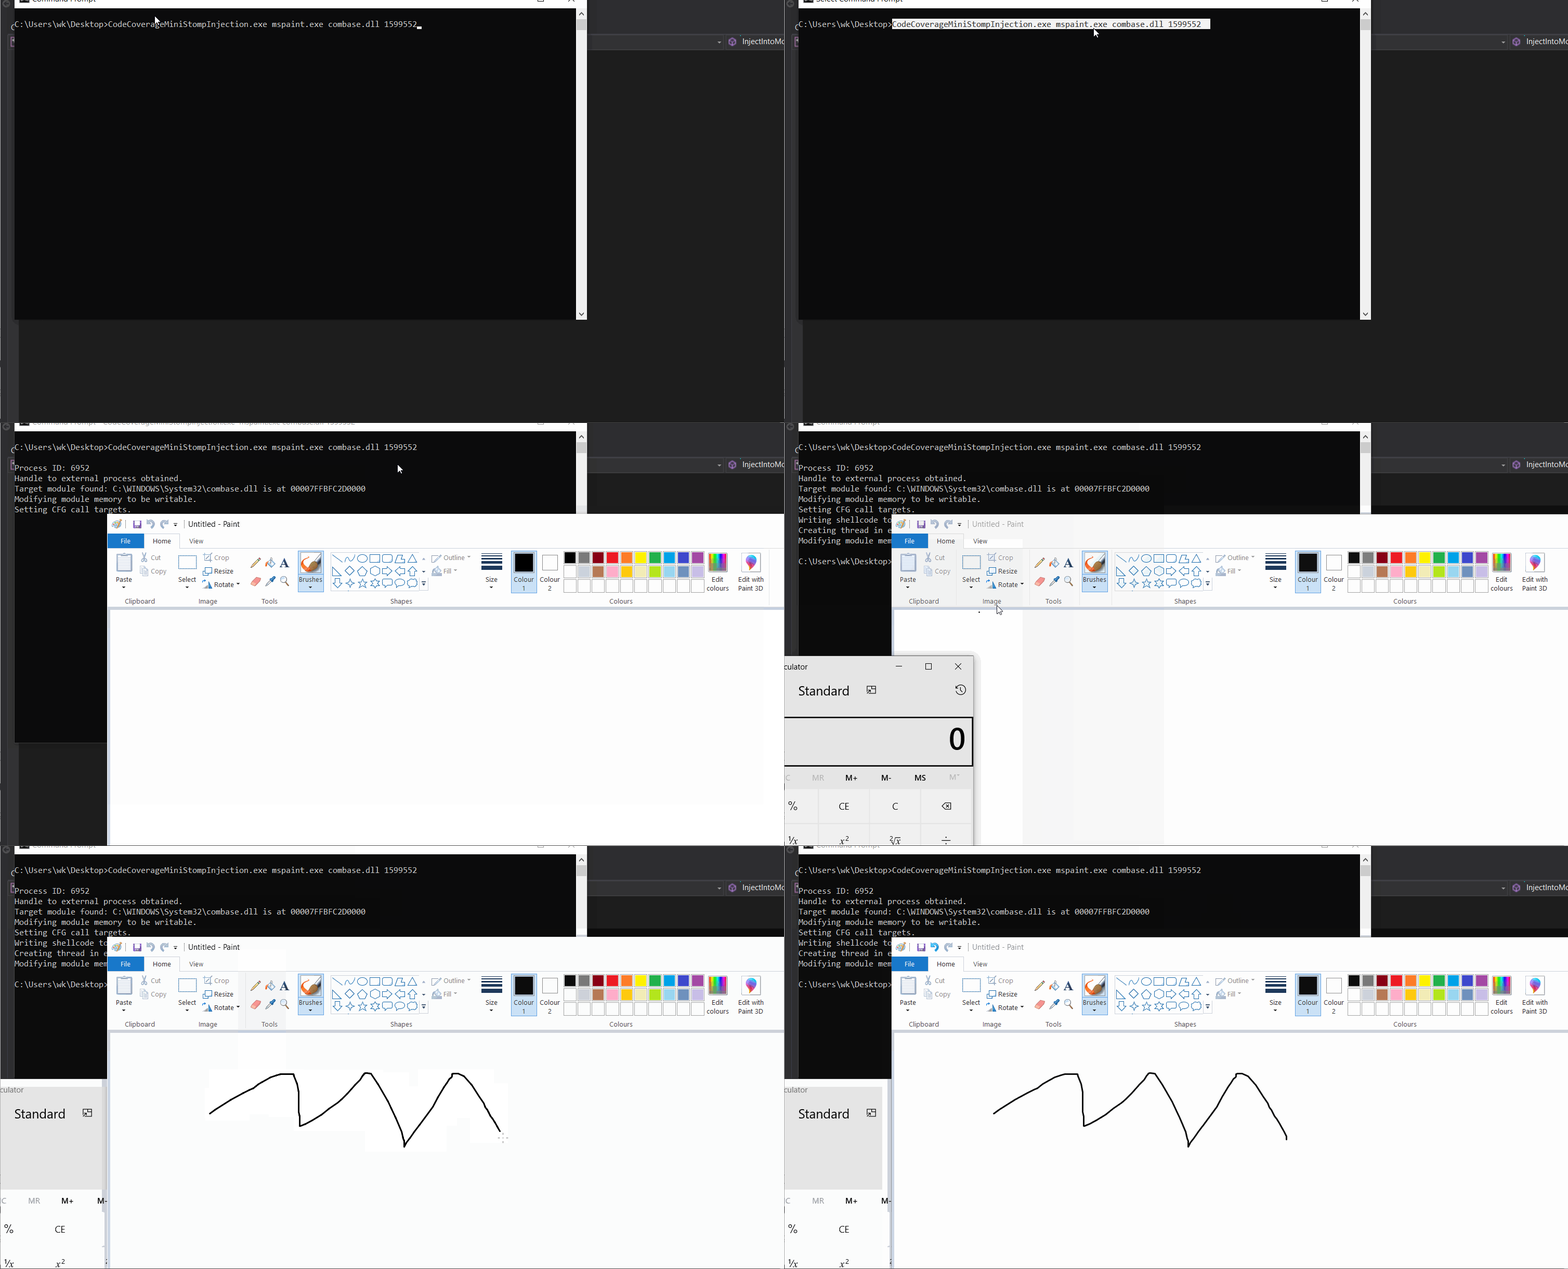
The following gif shows a basic example of this working based on the previous analysis. Some basic shellcode for spawning calc is injected into mspaint.exe in the combase.dll module at offset 1599552. mspaint.exe continues to be fully functional post-injection.

In summary
All in all, doing a "mini stomp" on unused code regions is an interesting variation of the traditional module stomping technique, but with its limitations, and could potentially be more useful with further research. As mentioned earlier I've put the script for analysing the drcov output on GitHub. I've also included a Windows executable that makes it easier to test this approach by injecting into a certain DLL at a particular offset, including patching valid call targets for CFG on Windows 10.
An important note here too is that you want to be using PIC shellcode. If you're using something with a reflective loader it's just going to allocate new memory (defeating the entire purpose). Ensure your shellcode runs where you write it.